Email marketing and public relations outreach top the list for free marketing channels, but when it comes time to spend money, many creators recommended Facebook ads. We decided to test the channel out ourselves by running a Facebook ad campaign for a live Kickstarter project.
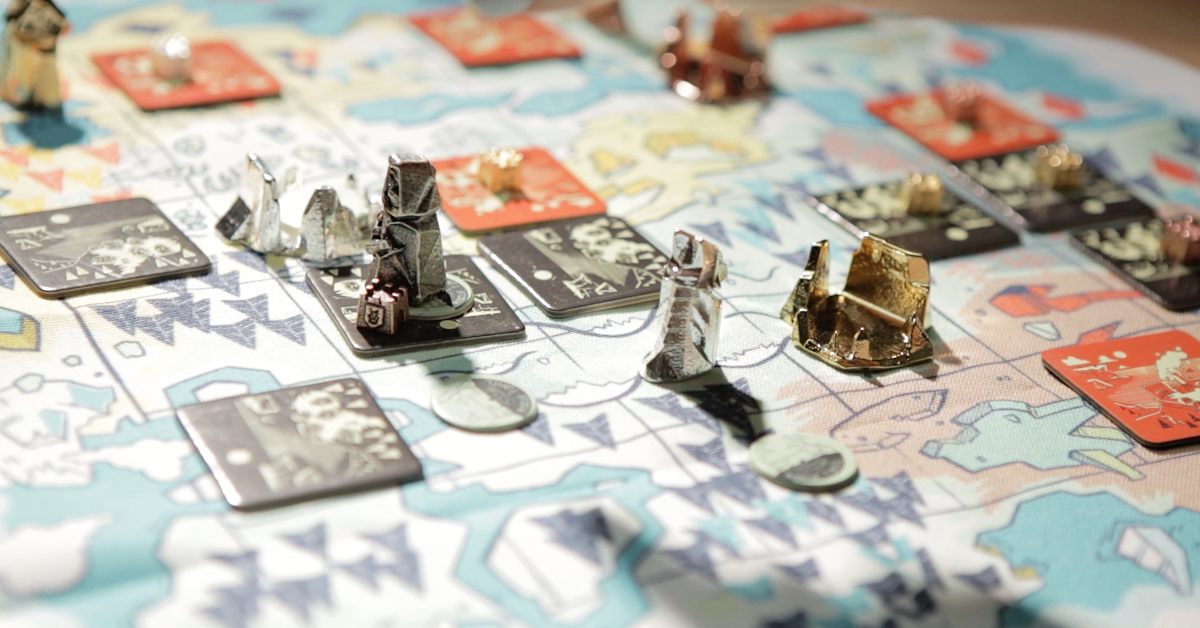
Our friends at Lay Waste Games, the makers behind Dragoon (the tabletop board game where you play as a dragon), happened to be launching a Kickstarter campaign for their new Standard and Gold Editions and the Rogue and Barbarian Expansion.
The team wasn’t planning to do any Facebook advertising for the campaign, but they’re cool people and they agreed to let us run a Facebook ad experiment for their campaign so we could share what we learn to help other creators.
We’re not Facebook experts (we specialize in making backer management software) but that wasn’t a problem. We wanted to approach the problem like eager beginners since that’s where most creators will be when they start running their own Facebook ads.
We agreed to pay for the advertising ourselves and Lay Waste Games would pay us 15% of whatever amount the ads raised for them. If our ads failed to attract backers, they wouldn’t be responsible for any of the costs. We came up with the 15% rate because the professional agencies charge anywhere from 20-35%. Making profit wasn’t our goal, so we hoped that 15% would be enough to cover our advertising expenses and we’d get a lot of great ad performance data to share with creators.
Estimating the Cost Per Acquisition
One concern going in was that the average pledge amount wasn’t going to be high enough to make the ad cost feasible. In online advertising, there’s the concept of cost per acquisition (CPA) which is the amount spent to acquire a customer. You can calculate your CPA by dividing your total spend by the number of customers acquired. For example, if you pay $500 on Facebook ads and it generates 20 backers, then your CPA is $25.
A $25 CPA could be good or bad for you depending on the price of your product. If your product is $200 and only costs $75 to manufacture and ship, then a $25 CPA would be fantastic since you’ll generate a $100 profit per customer. However, if your product is priced at $40 and it costs $20 to manufacture and ship each unit and your CPA is $25, then you’ll lose $5 on every transaction. If you have a lower-priced product or low profit margins, you will need a lower CPA to make the marketing channel profitable for you.
The Dragoon expansion and reprint campaign had several different pledge levels ranging from $30 or $40 for just the expansions all the way up to $650 for a premium Wyvern edition that comes with a handmade Wyrmwood board. We estimated that the average pledge amount would be around $75 which would give us a target CPA of $11.25 ($75 x 15%) to break even.
Given that the average Facebook CPA is $18.68 according to Wordstream, it looked like we were going to be in a tough position trying to hit a $11.25 CPA.
If you are considering using any paid advertising channel, figure out how much you can afford to spend to acquire each customer. This will help you set your CPA target and you’ll be able to tell if ads are profitable or not based on the actual CPAs you see once you have live performance data.
Audience Targeting is Essential
Facebook performs well because it’s excellent at giving you ways to customize the audience that sees your ads. You can target people by age, gender, location, language, and specific interests.
Two of Facebook’s most effective targeting features are custom audiences and lookalike audiences. Custom audiences allow you to target people that you already know. You can use customer lists, website traffic, or Facebook engagement activity to create custom audiences.
The main drawback with custom audiences is that the size of each audience is limited by the customer list that you provide. If your audience size is only a thousand people, you can exhaust that list very quickly with just a few dollars in ad spend. That’s where lookalike audiences come into play. You can give Facebook a custom audience and ask them to create a larger audience that has similar attributes.
A lookalike audience will give you more people to advertise to and it’ll convert better than an untargeted list, but it won’t convert as well as your custom customer audience since it’s a larger group of people that aren’t customers yet.
Generating Audiences
The easiest way to waste your advertising budget is to put your ads in front of the wrong audience, so we set aside a small budget to test out different audiences.
We started with the backer list from the first Dragoon campaign and used it to generate a custom audience. When you generate a custom audience your browser hashes the email addresses and uploads the hashed data to Facebook. Then Facebook compares the data to its hashed user data to find any matches and saves them into a custom audience. It’s a complicated process but it ensures that you never share actual email addresses with Facebook so you keep backer data private.
This is when we encountered our first problem. The original campaign and pre-order backer list only turned up 1,200 matches, which means that advertising to just this list would generate less than 40 clicks per day if we maxed out our spending. If clicks convert into pledges at 2.5%, then we could only expect this list to generate one pledge per day and advertising at that rate would exhaust the list quickly and ads would become ineffective in a matter of days.
We needed to find larger audiences to drive more potential pledges. Our solution was to use the Dragoon backer audience to create several Lookalike audiences segmented by country.
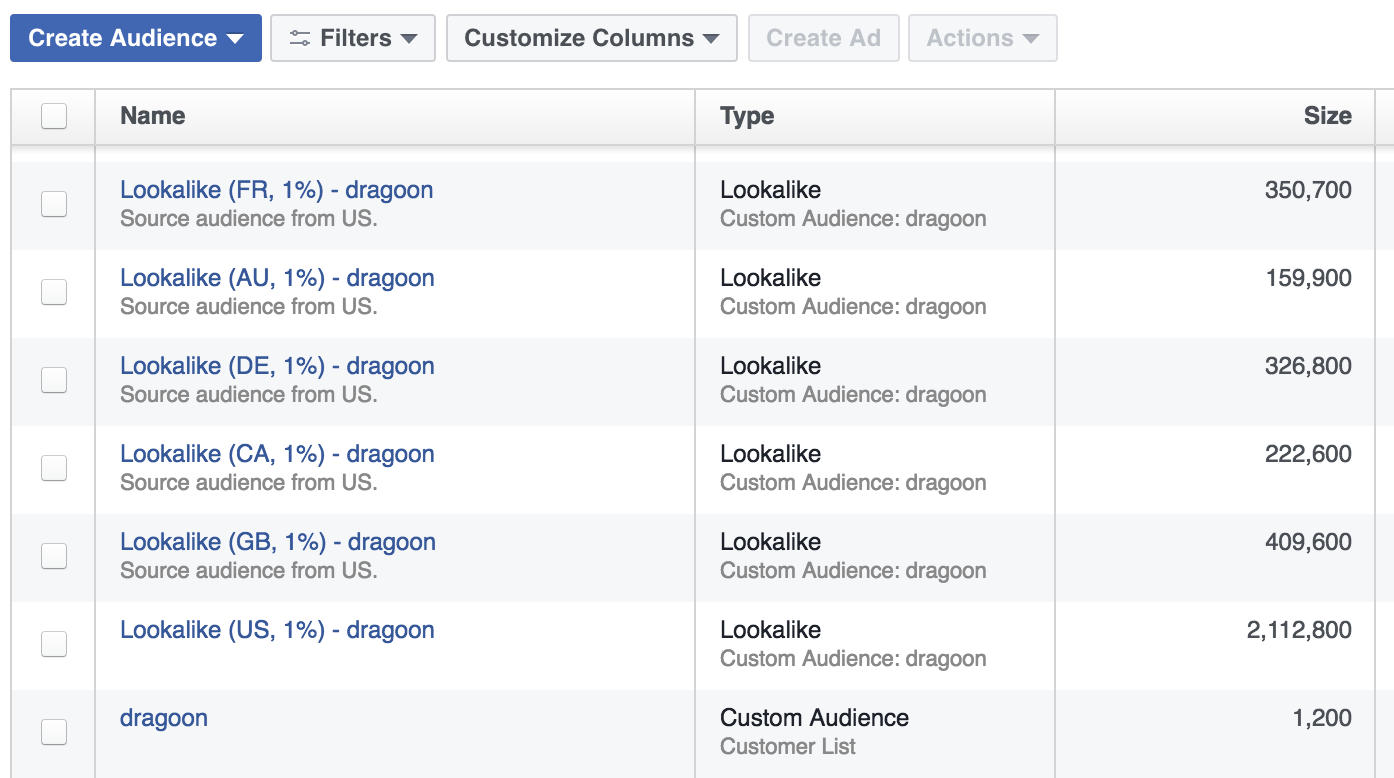
We ended up creating a lookalike audience in the United States for our test audience. The original Dragoon campaign didn’t have EU-friendly shipping, so the backer list had a higher percentage of backers from North America. Once we had our test audience, it was time to create our campaigns, ad sets, and the actual ads.
Creating the Ads
We created a single “Dragoon” campaign with the objective to drive in website traffic. There are other objectives like engagements, website conversions, and lead generation but website clicks made the most sense to us. Website conversions sounds like a promising option but, as far as we know, there’s currently no way to install the Facebook conversion pixel on your Kickstarter campaign page.
After we had our campaign ready, we set up an ad set for the US lookalike audience. Organizing your ads by campaign and ad sets makes it possible to separate out performance data to let us see what ads work best for each audience. It’s common to divide ad sets by audience country for example.
Then we created ads for our ad set. For the initial audience testing, we went with basic single-image ads. We had five images to test, so we created five ads with identical headlines and text descriptions but different images.
For the text, we tried piquing viewer interest by mentioning the special offer and that the first edition sold out, and creating a sense of urgency by emphasizing the time left in the campaign.
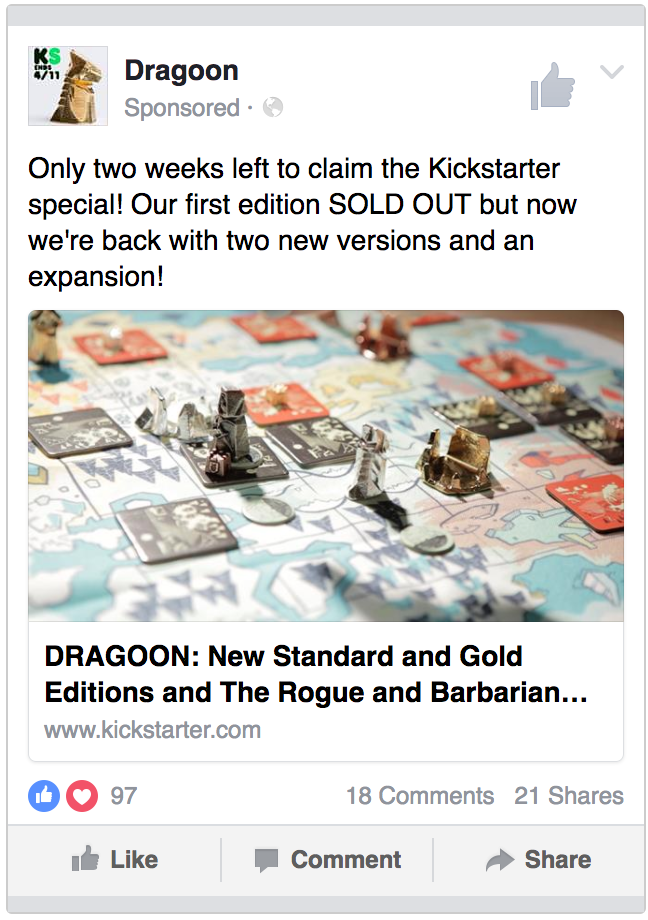 The Lay Waste Games team created several custom referral links in the Kickstarter dashboard for us to use to track conversions and we created a spreadsheet to track ad spend, reach, clicks, conversions, cost per click and cost per acquisition each day. Kickstarter doesn’t give you a way to filter referral conversions by day, so we had to be diligent about recording our conversion counts once a day to make sure that we had an accurate view of our Facebook ad performance.
Evaluating Performance
We started the US lookalike ad set about halfway through the campaign with a daily budget of $20 and ran it for a week.
Dragoon, US 1% Lookalike Audience
- Reach: 17,271
- Clicks: 495
- Conversions: 4
- Spend: $127.63
- Cost per click: $0.26
- Click-through rate: 2.87%
- Conversion rate: 0.8%
- Cost per acquisition: $31.91
The cost per click started out at $0.37 on the first day but quickly fell to $0.32 on the second day and settled at $0.26 by the end of the week-long test. All of the ads had a Relevance Score of 8 or 9, so that helped lower our average click cost.
The good news was that our average pledge amount came in higher than expected at about $93.00 per backer which brought our break-even CPA up to $13.95. The bad news is that our conversion rate was terrible at 0.8% and the cost to acquire each backer was $31.91. We ran another smaller test with a Canada Dragoon backer lookalike audience that brought in 95 clicks, with two pledge conversions, and cost $56.21 for a CPA of $28.11.
We tried ads with lookalike audiences a couple times during the campaign but were never able to get ads to consistently produce CPAs below $25. Getting a 3-to-1 return on ad spend in an initial test would have been an acceptable result for many projects running ads on their own but that kind of return wasn’t going to break even for us.
Making Adjustments
The tests showed that our ads could generate clicks and those clicks converted into pledges but they just weren’t effective enough. We needed to lower our cost per click or increase our conversion rate, preferably both, in order to lower our CPA.
The ads were good enough to get clicks at a reasonable cost but the people weren’t converting when they reached the Kickstarter campaign page. We had to improve our audience targeting to get in front of more people that might want to back a Kickstarter game.
You don’t need to have a BackerKit account to answer a project survey, but hundreds of thousands of backers have created accounts over the years. We segmented the accounts by backers that had an affinity for tabletop games and used them as a test audience to see if we could achieve a lower cost per acquisition. Maybe they would be more likely to convert because they’ve actually backed game projects in the past.
We put together the audience and created the new ad set using the exact same images and copy. Here’s how that test performed:
Tabletop Backer Audience
- Reach: 16,506
- Clicks: 870
- Conversions: 19
- Spend: $205.44
- Cost per click: $0.24
- Click-through rate: 5.27%
- Conversion rate: 2.18%
- Cost per acquisition: $10.81
Success! Improving our targeting almost doubled our click-through rate, nearly tripled our conversion rate and brought our CPA down to $10.81. Note that we only used backers that personally signed up for BackerKit for this test but people that didn’t have accounts could still see ads if they were included by Facebook in a lookalike audience.
Engagement Matters
When we reviewed the earlier tests to see which images had the best click-through rates we discovered that there wasn’t a single best-performing image.
Whichever ad happened to get engagements such as likes, comments, and shares the earliest performed the best and the effect would snowball because Facebook would show that ad more and it would earn even more engagements.
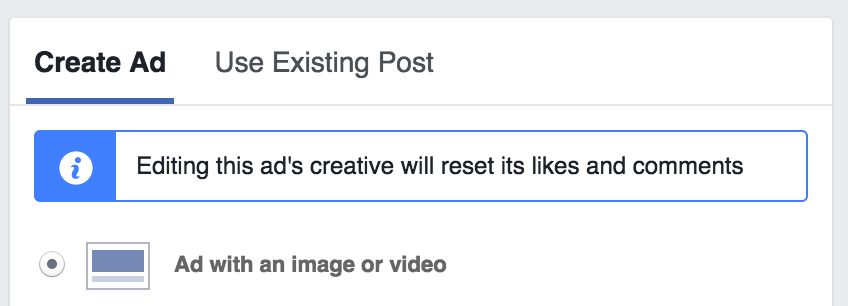
We also learned to be smarter about including time-sensitive information in the ad text. If you edit the image or the copy in an ad it will reset the likes and other engagements. All of those ads that had mentioned that there were only two weeks left to back the campaign had a lot of likes and shares but we couldn’t adjust the text as we closed in on the campaign end date.
Next time we’ll try using text that will work through the entire campaign duration. We’d also try experimenting by showing an ad to a very friendly audience first, such as existing fans and customers, just to build up the likes and then adding in a broader audience once the ad had built up an impressive amount of social proof.
Videos vs. Images
Once we had our audiences working, we decided to see how video ads perform. We uploaded the new Dragoon campaign video and then we used Facebook’s captioning tool to add text captions that display when videos auto-play in silent mode.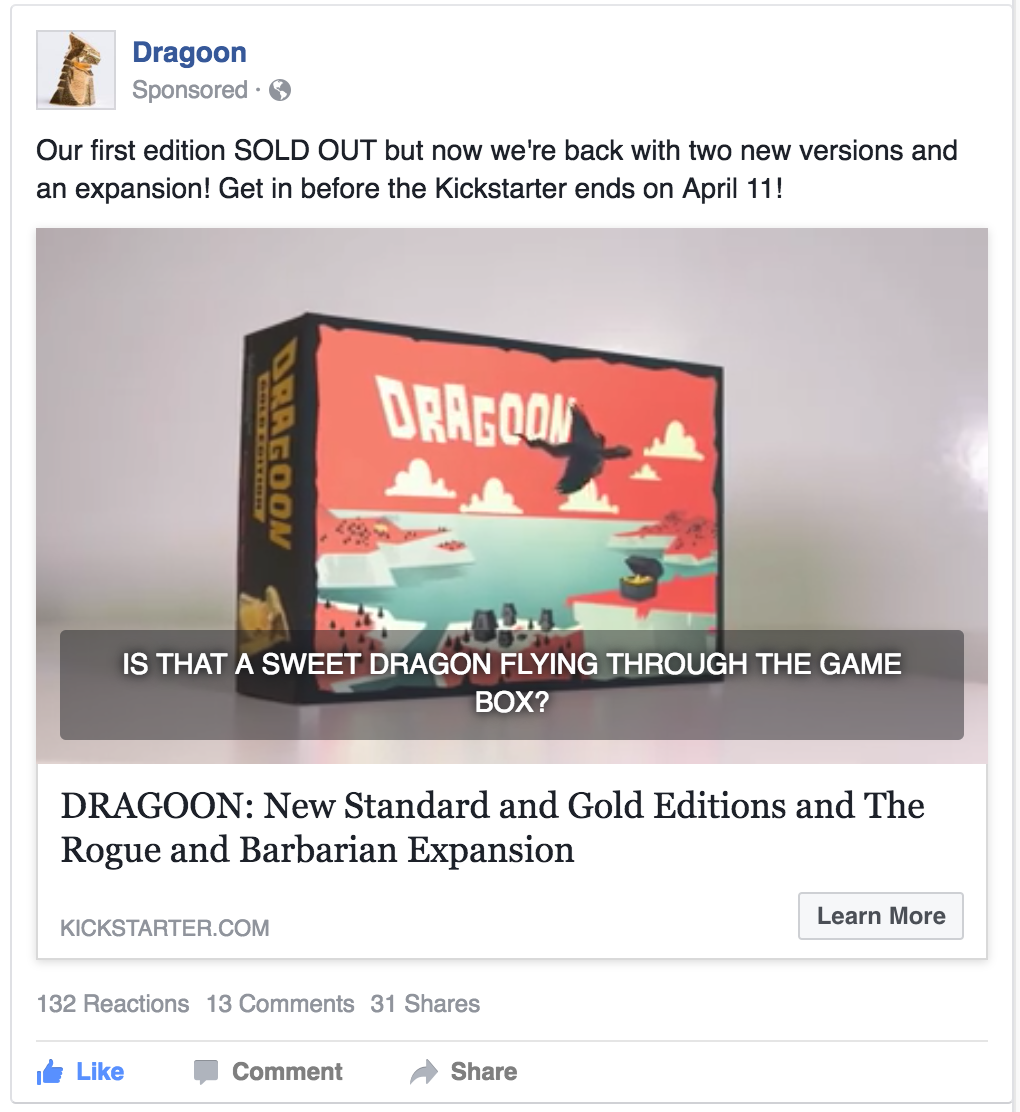
We were worried that we’d lose viewers early because the campaign video has a long opening animation, so we added extra caption text to keep viewers engaged. It takes extra work to set up captions but it’s worth it because many people browse Facebook with their phones on silent.
Here’s how the two ads performed:
Single-image Ad
- Reach: 18,394
- Clicks: 521
- Conversions: 16
- Spend: $214.16
- Cost per click: $0.41
- Click-through rate: 2.83%
- Conversion rate: 3.07%
- Cost per acquisition: $13.39
Video Ad
- Reach: 63,923
- Clicks: 2712
- Conversions: 56
- Spend: $881.22
- Cost per click: $0.32
- Click-through rate: 4.24%
- Conversion rate: 2.06%
- Cost per acquisition: $15.74
We found that the campaign video ad was better at generating clicks with a 4.24% click-through rate compared to 2.83% for the image ad. The video ad also generated far more reactions, comments and shares, but the image ad had a better conversion rate with 3.07% compared to 2.06% for the video ad.
Facebook automatically allocated budget between the ads because they were in the same set, and the system gave video ad four times as much budget as the image ad by the end of the campaign. We increased the ad budget from $100 per day to $200 per day through the last three days but clicks became more expensive after we increased our budget, rising from $0.28 per click up to $0.42 per click which hurt our CPA.
We can’t draw any definitive conclusions with our small sample size but the limited results show us that video ads are worth trying.
Timing matters. We noticed that conversion rates started rising significantly once the time urgency kicks in and the Kickstarter countdown timer switches from counting down days to hours.
The video ad we tested started five days before the end of the campaign on April 6 and had a 1.90% conversion rate on the first day but the conversion rate was down to 1.39% just two days later. In the final two and a half days of the campaign, the conversion rate rose to 2.75%. That’s an incredible swing and we would have missed out on the conversions if we disabled the ad early.
Your Results Will Vary
Ads are complicated and there are so many variables in play with your audience make-up, ad copy, and crowdfunding campaign quality that guarantee that you will see different results if you try running your own ads.
We had major advantages because the Dragoon expansion campaign provided great media assets and the campaign was already at 5x its funding goal when we started sending in Facebook ad traffic. Backers could also have increased confidence in backing a project that had already successfully fulfilled one campaign.
We had an incredible audience advantage. If we had continued using only lookalike audiences, it’s very likely that our CPAs would have stayed in the $30 range which might be a reasonable target CPA for most campaigns.
If you’re going to run Facebook ads for your project we recommend starting them later in the campaign after you have a respectable funding amount and running them through the very end.
Calculate your break-even cost per acquisition ahead of time and constantly monitor performance so that you can improve on audience targeting and ads during your campaign.
